GTrends
GTrends
Trends in the real estate market in the third quarter of 2020
Num. 7 - September 2020
Highlights of the quarter: July - September 2020
We present a new Gtrends Report, corresponding to the third quarter of the year 2020 where Gloval offers an interesting analysis on the trend of the Spanish real estate market, in which new elements of the most current situation of the Spanish economy and its link with the real estate sector appear. Click below to see the full report:
Macroeconomic environment
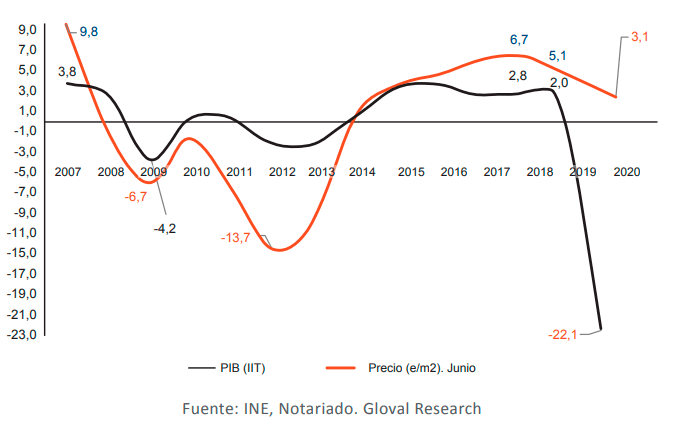
Como se esperaba, el dato de avance en la tasa interanual del PIB correspondiente al segundo trimestre del presente ha sido demoledor, con el -22% respecto al segundo semestre del 2019.
Residential segment
El nivel de confianza de los consumidores en junio ha mejorado 3,4 puntos respecto a marzo, quizás por la apertura de medidas de desconfinamiento.
Logistics/Industrial segment
It is reaffirmed once again that this is the real estate segment that has not experienced a decrease in activity, but rather the opposite, being, in the face of the adversity of movements, confinements and sanitary precautions, an activity of prime necessity for the distribution of goods.
Office segment
As long as the pandemic situation remains out of control, remote work will continue to play a major role in many companies. Since March, rent levels in newly contracted office space have fallen by between 4% and 10% in exchange for extending mandatory deadlines.
Retail segment
Given the very close correlation between the evolution of retail sales consumption and Social Security affiliation, with the affluence in shopping centers, medium or local street level, it is clear that it is not the segment most favored by the state of alarm and evolution of the pandemic since March of this year and will probably continue for the remainder of the year. On the other hand, online sales continue their positive trend.
Hotel segment
Given Spain’s nature as a global tourist and vacation destination, this segment has experienced a hard hit in occupancies, with the drop in the first six months of the year being 55% compared to the same period in 2019.
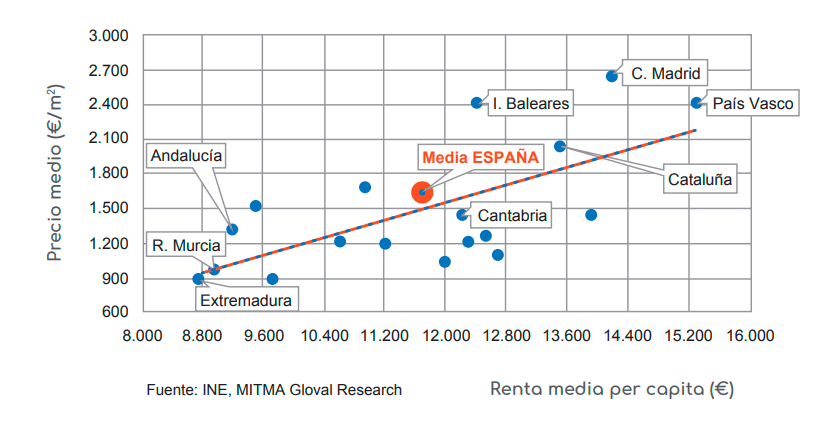
HOUSING. Evolution of income, average price and investment effort of households
Los principales indicadores de la actividad (inversión, transacciones, iniciación de obra nueva) y de los precios de la vivienda, desde el ámbito agregado han evolucionado positivamente hasta la llegada del COVID-19, que ha provocado un parón total en prácticamente toda actividad económica.
De acuerdo con el gráfico siguiente, existe una estrecha correlación entre la magnitud de la renta de las familias y las mayores alzas en los precios medios de vivienda libre.
PRIME YIELD. Specialized area in NPL and REO portfolio valuations of Gloval Group
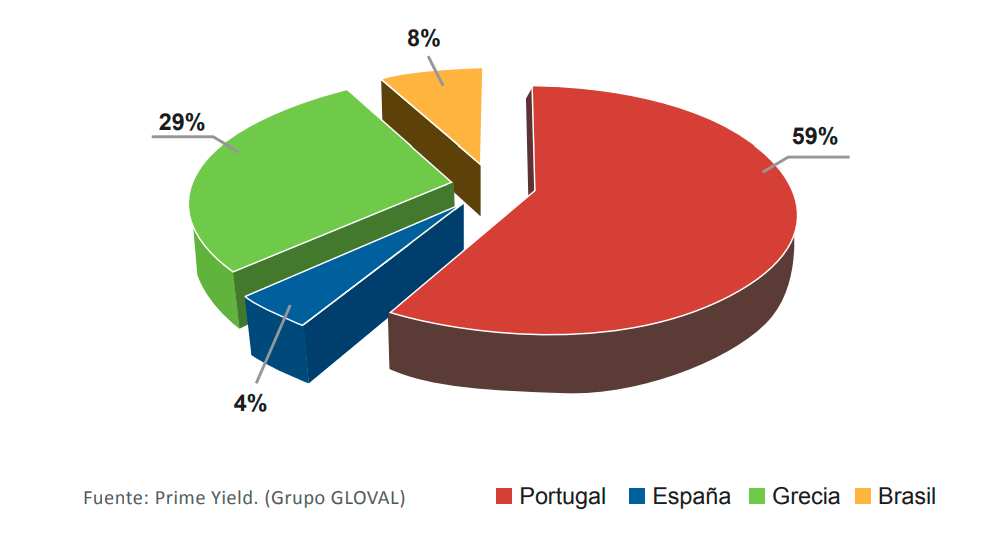
Dentro del Grupo Gloval y orientado de manera especializada a la valoración y consultoría de NPLs y REOs, se encuentra la empresa Prime Yield, presente en Europa y América Latina.
Los principales mercados de actuación en materia de NPLs y/o REOs se centran en Portugal, España, Grecia, Brasil, Italia… donde se han realizado actuaciones para las carteras: Pumas, Mars, Nata II, Sertorius, Neptune, Brick y Atlas III, Pillar, Smart, Neptune, Icon I, Icon II; Hedgehog.
Download the GTrends Report Num. 7 here:

 Descargar varios informes
Puedes descargar todos nuestros informes en el siguiente enlace:
Let’s have a chat
Let us know what you need and we’ll contact you as soon as possible.
They trust us