GTrends
GTrends
Trends in the real estate market in the second quarter of 2019
Num. 2 - May 2019
Highlights of the quarter: April - June 2019
Gloval launches its second edition of the Gtrends Report, corresponding to the second quarter of 2019, where it analyzes the keys to the Spanish real estate market, with relevant information on macroeconomic environment and different segments of the real estate sector, such as residential, logistics/industrial, office, retail and hotel.
Macroeconomic environment
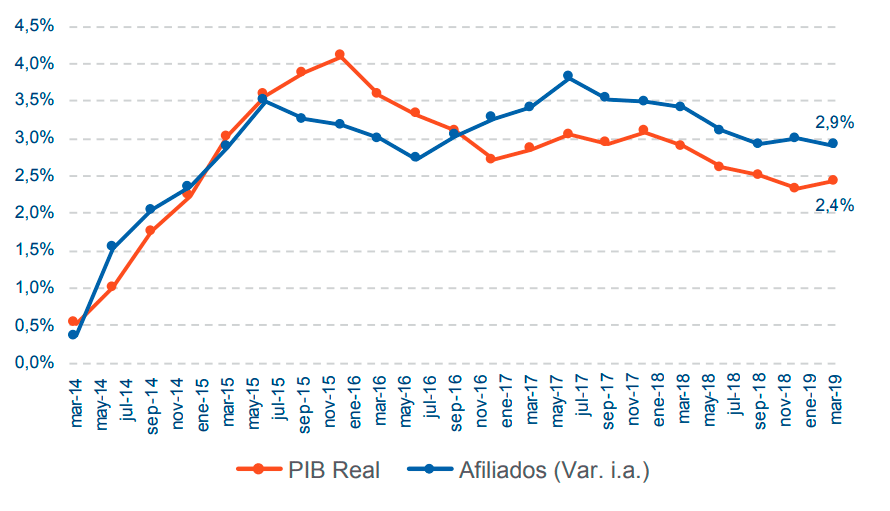
El avance de la Contabilidad Nacional Trimestral que publica el INE, muestra un repunte en la tendencia de la variación interanual del PIB para el 1T2019, con una tasa del 2,4%.
Residential segment
House prices on the free market rallied once again in 4Q18 and broke the €1,600/m2 barrier for the first time since 2012, according to the Ministry of Public Works data.
Logistics/Industrial segment
Investors continue to show an appetite for finished or under construction properties for storage and cross-docking facilities.
Office segment
Very active segment given the demand in Madrid and Barcelona, especially in the Services sector, with over 30% of total rents YTD.
Retail segment
In 2018, the sale of Shopping Centres and Retail Parks rose to 45,500 million euros according to the AECC, which was a 2.9% higher than in 2017.
Hotel segment
We continue to see strategic movements by private investors and chains and the outlook
for this year is still positive.
Valuations as an indicator of the real-estate sector
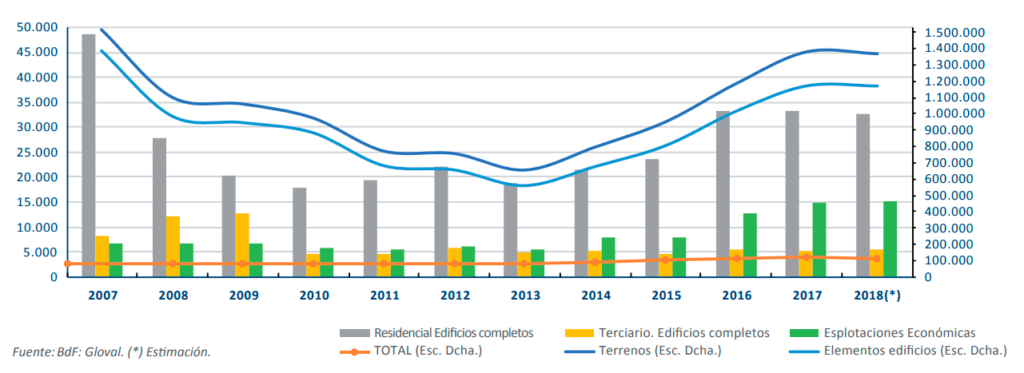
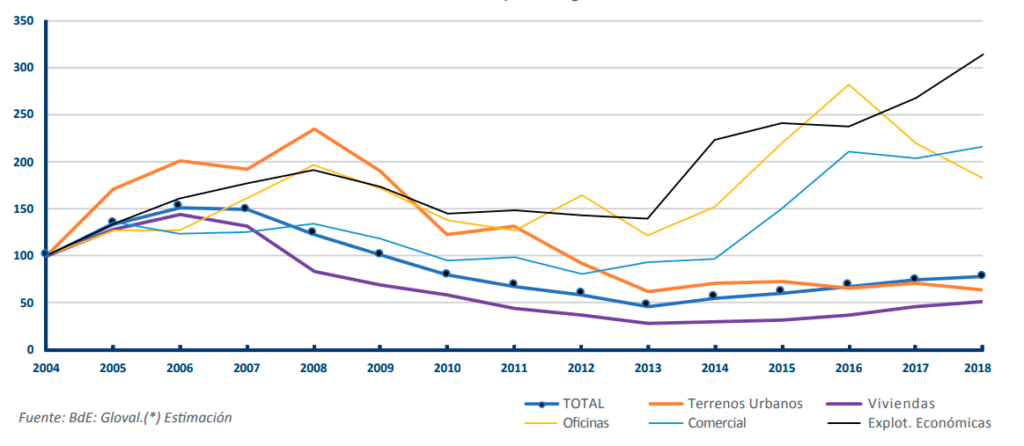
La evolución del número de tasaciones realizadas en España por las sociedades homologadas por BdE, refleja la recuperación experimentada desde 2008 en los diferentes segmentos del sector inmobiliario. En 2018, con datos a septiembre, puede estimarse un número de tasaciones en torno a 1,36 millones, con un volumen estimado de unos 440 mil millones de euros.
Por segmentos, los terrenos y elementos de edificios fueron los más activos en cuanto a tasaciones registradas, seguidos de edificios residenciales y explotaciones económicas.
GLOVAL’s valuation activity for Service Stations
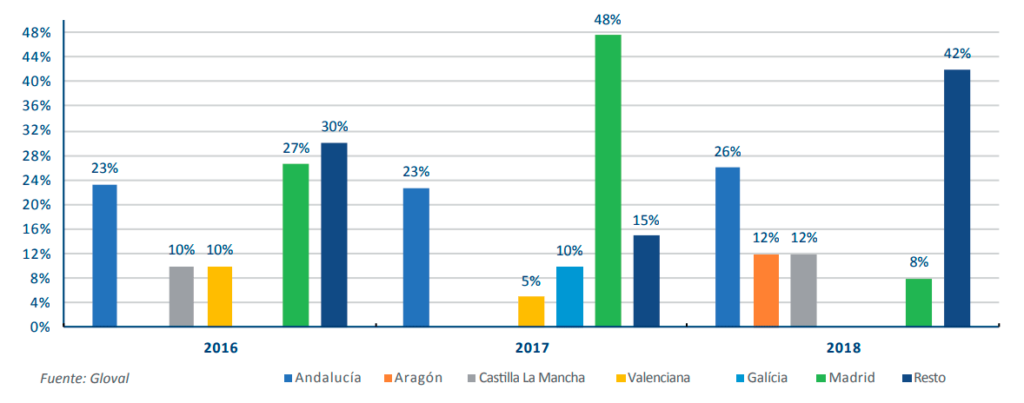
Grupo Gloval realiza un importante volumen de trabajos de valoración especializado en este segmento, tanto de la parte “Oil” como del “Non Oil”, para grandes operadores y para particulares.
Del total de trabajos realizados en los últimos 3 años, en el gráfico adjunto se identifican las principales Comunidades autónomas donde más actividad se ha desarrollado.
You can download the GTrends Report Num. 2 here:

 Descargar varios informes
Puedes descargar todos nuestros informes en el siguiente enlace:
Let’s have a chat
Let us know what you need and we’ll contact you as soon as possible.
They trust us